
NSW DPIRD · Environment
Orchard Change Monitoring
How GIS People turned six years of satellite imagery into a traceable, year-by-year record of Integrated Orchard Management adoption across the NSW macadamia industry, without relying on grower surveys.
Published
Integrated Orchard Management (IOM) is the NSW Department of Primary Industries and Regional Development’s (DPIRD) practice framework for more sustainable macadamia orchards. It rests on three pillars, drainage, orchard floor and canopy: opening up the canopy lets light reach the orchard floor, better ground cover and drainage keep soil and nutrients on the block, and the department’s own trials have measured soil loss falling by around 95 per cent on IOM plots. Knowing how widely growers have adopted those practices, orchard by orchard and year by year, is what lets DPIRD target its extension work and measure the programme’s effect on the landscape.
Challenge
Grower surveys typically captured only 20–30% of the industry, and the responses were shaped by self-selection: the growers most engaged with IOM were the ones most likely to reply. DPIRD needed an objective, scalable and repeatable way to track IOM adoption across the whole macadamia landscape.
The real need was to see orchard change at landscape scale, year after year, rather than a partial snapshot whenever a survey ran.
Solution
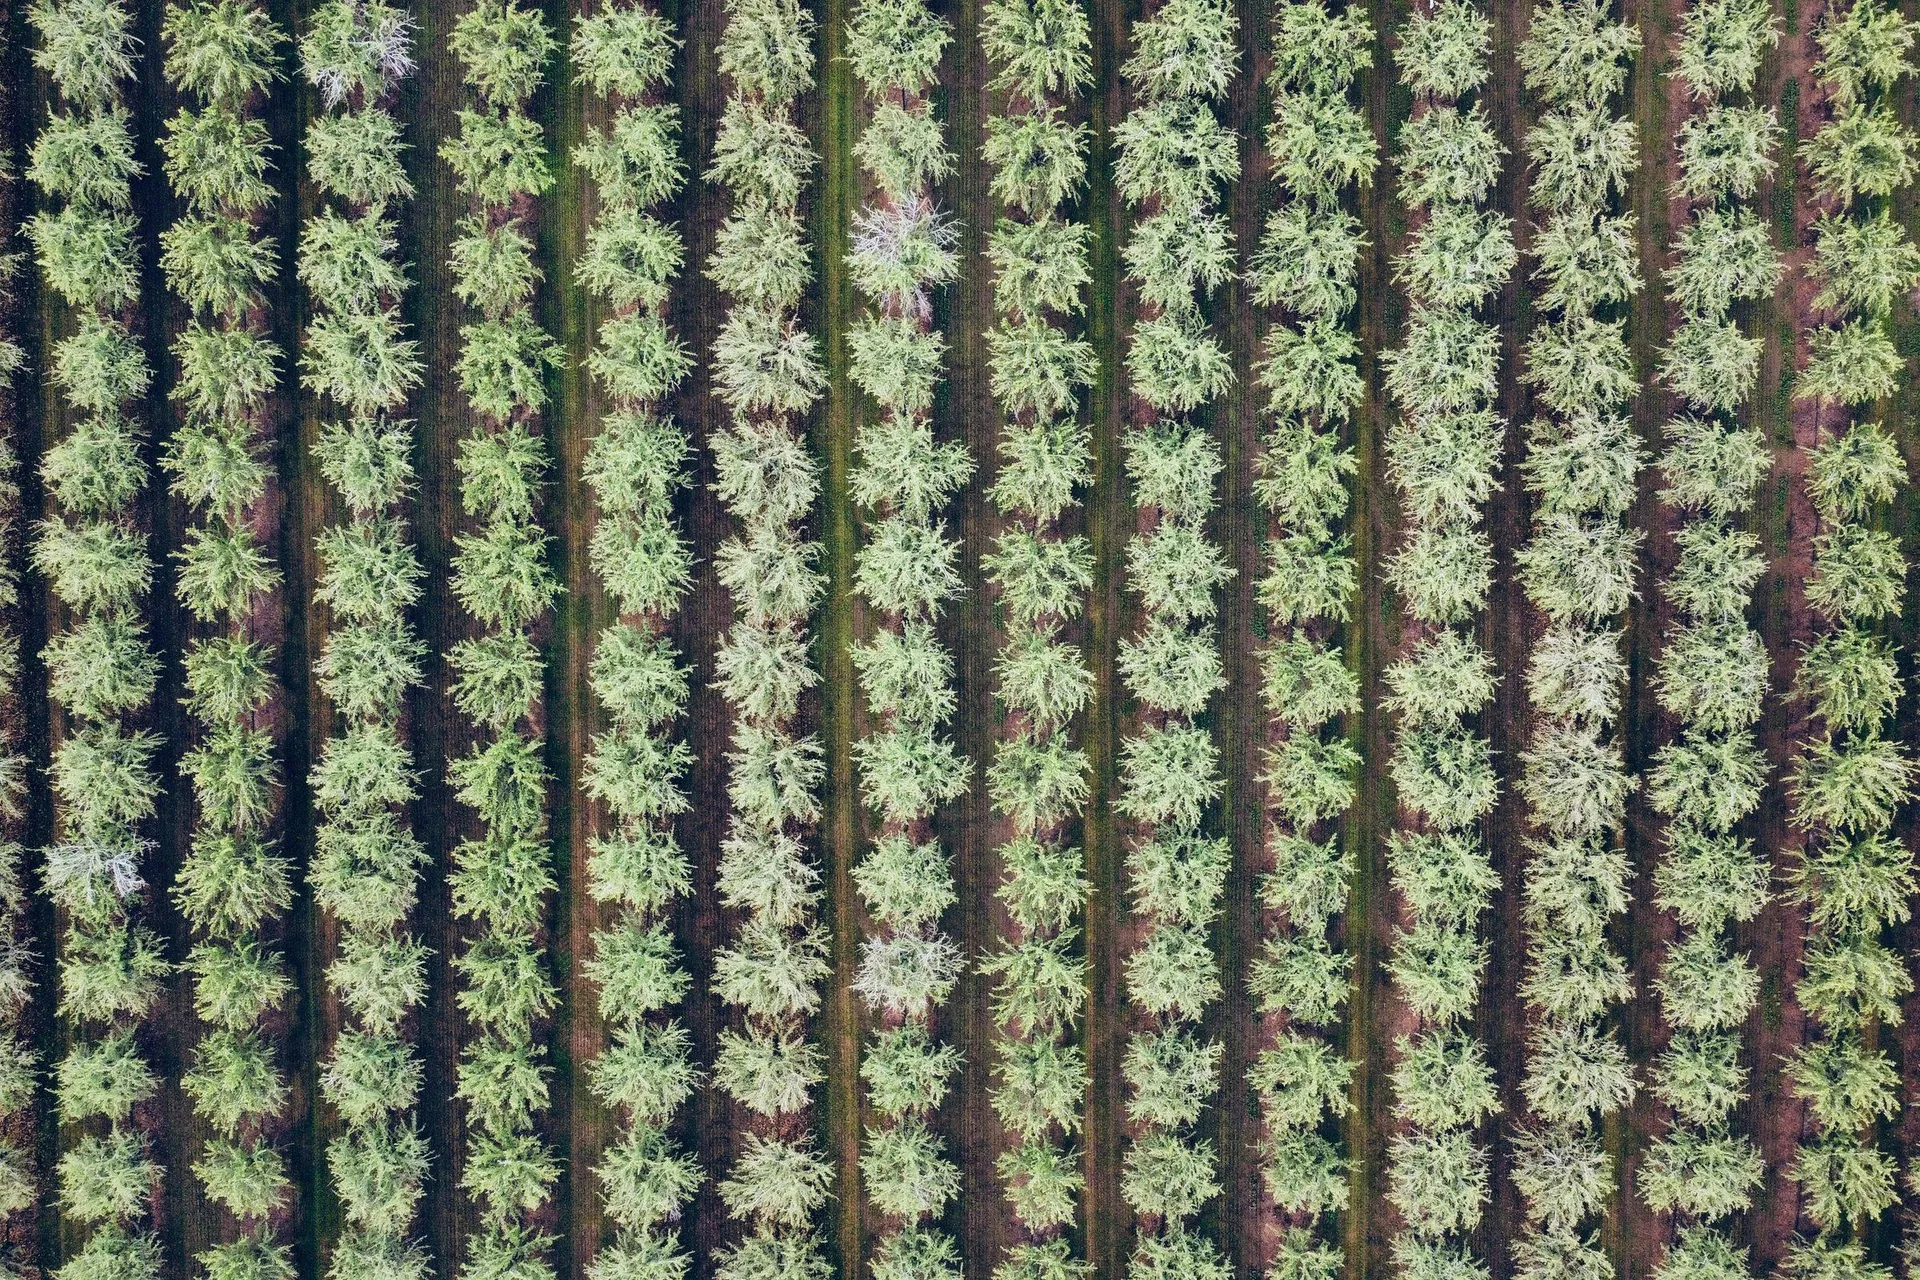
GIS People began by intersecting orchard footprints with cadastral parcels to create analysis-ready polygons, so that every observation could be tied to a specific orchard and property. The team then interpreted satellite imagery from six years between 2016 and 2024. The green normalised difference vegetation index (GNDVI) highlighted where canopy had changed between years, and expert review classified the changes in trees, canopy, soil and drainage that mark IOM practices, linking every observation back to its source imagery.

Outcomes
- A spatial-temporal orchard dataset covering every orchard across all six imagery years, comparable across orchards and years.
- Consistent classifications with full imagery and analyst traceability, so any observation can be checked against the image it came from.
- A machine-learning labelling workflow and an automation roadmap: the classified record is the high-quality labelled data that future automated IOM detection will be trained on.
- A repeatable foundation for monitoring IOM adoption at industry scale, turning imagery into decision-ready evidence.

What is changing across your landscape? We use satellite and aerial imagery to turn change across orchards, crops and landscapes into structured, decision-ready data. Talk to GIS People about yours.